2020-6-23 23:00 |
Bitcoin is currently trading just below its most important resistance yet, gearing up for what most crypto analysts expect to be a major move.
However, data suggests that sell pressure from miners adjusting to the newly reduced block rewards combined with quiet accumulation may be responsible for the recent sideways price action.
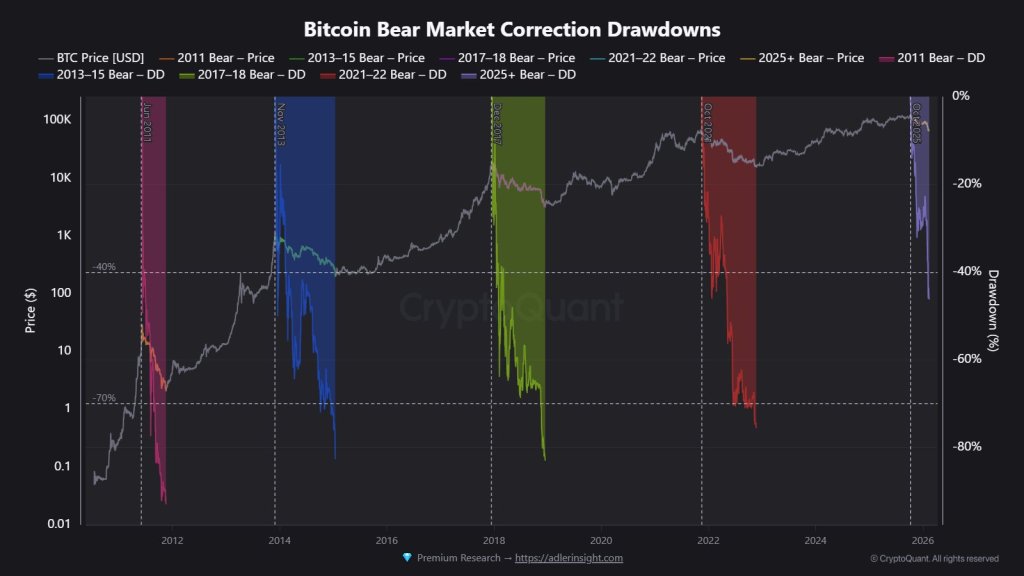
Bitcoin Sideways Trading Continues, But For How Long?Bitcoin’s halving was the most talked about topic of the cryptocurrency industry for the last year.
Once it arrived, analysts were torn on what to expect post-halving. Bullish investors expected an immediate bull market. More skeptical traders had expected a post-halving selloff due to miners capitulating to occur.
One expert suggested Bitcoin could trade sideways for another one hundred days following the block reward reduction.
Related Reading | Data Shows Bitcoin More Likely To Pump Following Consolidation, 20% Move Anticipated
Thus far, the leading cryptocurrency by market cap has traded sideways for 54 days and counting, nearly half of what the expect had suggested.
But why hasn’t the notoriously volatile cryptocurrency moved much either way and what are the underlying factors causing it? Data suggests it could be supply and demand coming into balance.
Post-Halving Miner Supply Meets Retail And Institutional Accumulation DemandWith Bitcoin seemingly going nowhere fast, analysts are scouring any data point they can get their hands on.
Technical analysts are performing technical analysis and looking over chart patterns, while fundamental analysts are reviewing things such as mining difficult, hash rates, cost of production, and more.
Combining the two tools are the key to the best investment and trading performance. Comparing fundamentals with technicals can often shed additional light into what’s fueling the underlying price action.
Following Bitcoin’s halving, the cryptocurrency is undergoing some interesting changes. An important fundamental analysis tool called the Puell Multiple, which has recently been “screaming buy,” has shown Bitcoin reaching a key level repeatedly since the halving.
After previous halvings, the same sort of “chop” in the indicator coinciding with a “price floor” took place before the new uptrend officially began.
1/ Puell Multiple keeps dipping in and out of the green accumulation zone as miners grapple with recent difficulty adjustments.
Solid risk-reward opportunity for long term $BTC investors around these levels (green zone).
Live chart: https://t.co/G9HDcO2ObT pic.twitter.com/HCBIaFwdwX
— Philip Swift (@PositiveCrypto) June 22, 2020
During each post-halving phase, Bitcoin price also traded sideways the entire time, setting the base from which the bull market began from.
If the same price action follows the most recent halving, this sideways price action will continue until Bitcoin price finally breaks to the upside. Any break of resistance at $10,000 could cause the asset to pass through and never again trade below five digits again.
Related Reading | ‘One of the Greatest Ever’ Indicators Is Screaming Buy Bitcoin at $9,000
This price floor is being put in, due to demand and supply coming into balance. As miners adjust to post-halving difficulty increases and the rising cost of production, this sell pressure could be masking massive accumulation going on just ahead of the bull run.
Retail investors, institutions, and more may be buying up just enough of the Bitcoin supply to keep any supply being dumped by miners from having a significant impact on prices.
origin »Bitcoin price in Telegram @btc_price_every_hour
Bitcoin (BTC) на Currencies.ru
|
|